
Vea también


 19.10.2026 12:48 PM
Bitcoin weathered the weekend calmly, although Wall Street had a real scare on Friday. It now trades around $82,233, comfortably above $80,000 and inside the recent corridor.
First, let's describe what happened on Friday. The VIX index, known as Wall Street's fear gauge, jumped 21.5% to 19.99. In simple terms it shows how large moves in stocks traders expect over the next four weeks. When people get nervous, they buy protection against sharp moves, and the index rises. The S&P 500 fell 1.09% that day, and the VIX's one-day rise was the largest since June 5. There are several reasons. AI-related stocks plunged over the week, and credit-default protection for debt of such companies rose to record levels. Added to that was oil: on Saturday Iran reported two tankers caught fire after striking mines in the Strait of Hormuz, and tensions also increased on the Russia–Ukraine front.
Many traders believe that despite the current market retracement higher, fear will return. Bitcoin confirms that picture. The Bitcoin volatility index BVIV from Volmex fell 1% on Friday, stayed just below 40%, and has since been almost unchanged. I think the market will calm in the coming days, and Bitcoin will remain inside the corridor above $80,000. I lean toward the view that the main risk to this scenario remains the Strait of Hormuz: fresh reports about tankers and oil could quickly bring fear back and hit all risk assets at once. If oil does not rally, Bitcoin has a chance to wait quietly for clearer signals.
Technical analysis and recommendations:
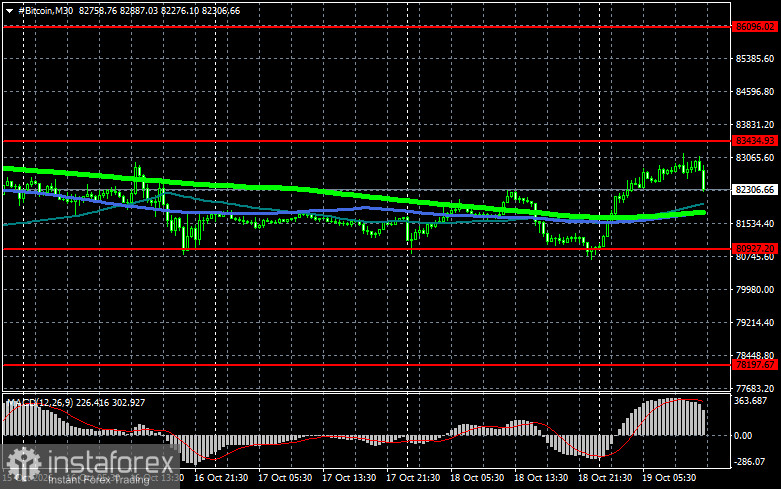
Technical picture for Bitcoin
Buyers are currently targeting a reclaim of $83,400, which would open a direct path to $86,000 and then toward $89,000; breaking $89,000 would signal attempts to restore a bull market. On the downside, buyers are expected at $80,900. A return of the trading instrument below that area could quickly push BTC toward $78,100. The most distant downside target would be around $76,900.
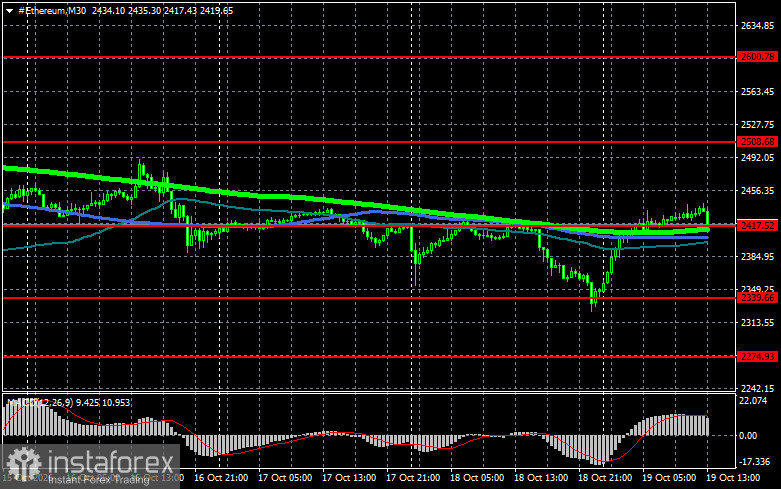
Technical picture for Ethereum
A clear hold above $2,508 would open a direct path to $2,600. The furthest upside target is the high near $2,679; breaking that level would indicate strengthening bullish sentiment and a return of buyer interest. On the downside, buyers are expected at $2,417. A return below that area could quickly push ETH toward $2,339. The most distant downside target would be around $2,274.
What we see on the chart:
- Red lines indicate support and resistance levels where either a price slowdown or active growth is expected;
- Green lines indicate the 50-day moving average;
- Blue lines indicate the 100-day moving average;
- Light green lines indicate the 200-day moving average.
A crossover, or a price test of moving averages, typically either halts the move or sparks fresh market momentum.


