
Vea también


 19.10.2026 04:59 AM
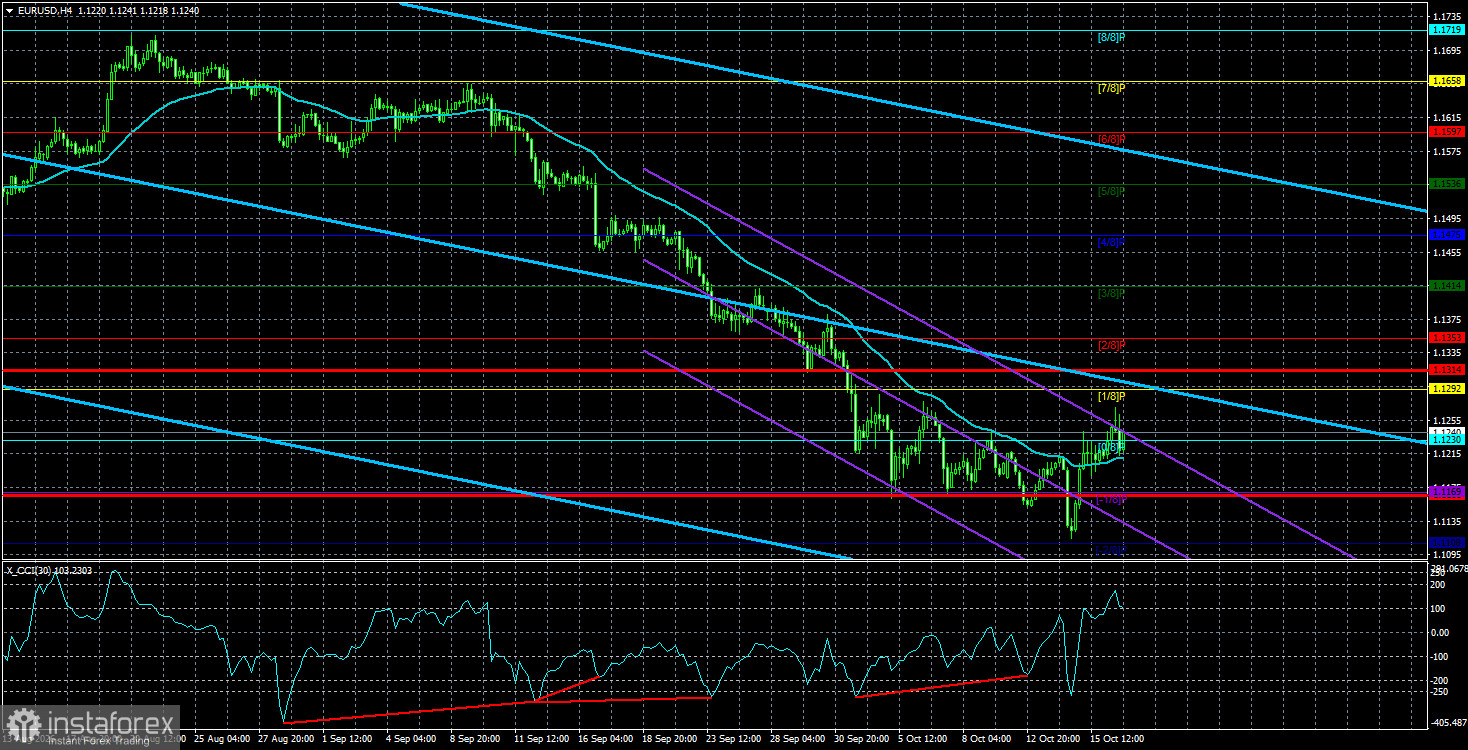
The EUR/USD pair continued to rise moderately on Friday — and I say "moderately, but still" because over the past month any gain in the euro has become an event to celebrate, like payday or the start of a holiday. For the last month we have argued that the dollar's advance was wholly illogical and purely speculative. Early in that period, the dollar's strength could be explained by a Federal Reserve rate hike and then by rising market expectations of further tightening, but after that, explanations ran out. Most market participants began inventing rationales rather than admitting the move was irrational and not supported by fundamentals or macro data.
Yet on Thursday and Friday, the dollar had legitimate grounds to keep rising—and on those very days, when the macro backdrop favored it, it fell. Why? First, the market began taking profits on short positions built up all month. If the market starts taking profits, the probability of new dollar strength absent very strong reasons is low. Second, over the past month the market had already priced everything it could: higher-than-expected US inflation and monetary tightening beyond official Fed guidance and the dot-plot. So after roughly a 500-pip dollar rally, one can again say the dollar has priced in its growth factors with a large margin.
The dollar can resume rising at any time—if market participants keep buying it, the rate will rise regardless of macro, fundamental, or geopolitical context. Any event, report, or headline can be interpreted to suit any narrative. For example, can we now claim that geopolitical tensions are rising globally? Yes — but are there concrete signs of escalation or deterioration in geopolitics? We do not see them yet. Meanwhile, the dollar could keep rising if the market starts pricing in scenarios as extreme as a third world war, a broader Russia-Ukraine conflict, or a Middle East conflict that spreads.
On the weekly chart, the dollar's entire 2026 advance is clearly a correction. For that correction to become a sustained trend, the EUR/USD pair would need to fall another ~1,000 pips. The dollar has gained about 800 pips this year, supported actively by Fed moves and Middle East geopolitics, while the market has often failed to acknowledge euro-positive factors. For example, the European Central Bank is preparing for a third policy tightening, while the Fed is considering only a second hike—and even that likely in December.
Therefore, our view remains unchanged. The current dollar rally is a long-term correction. The lower EUR/USD falls now, the stronger its subsequent rise is likely to be.
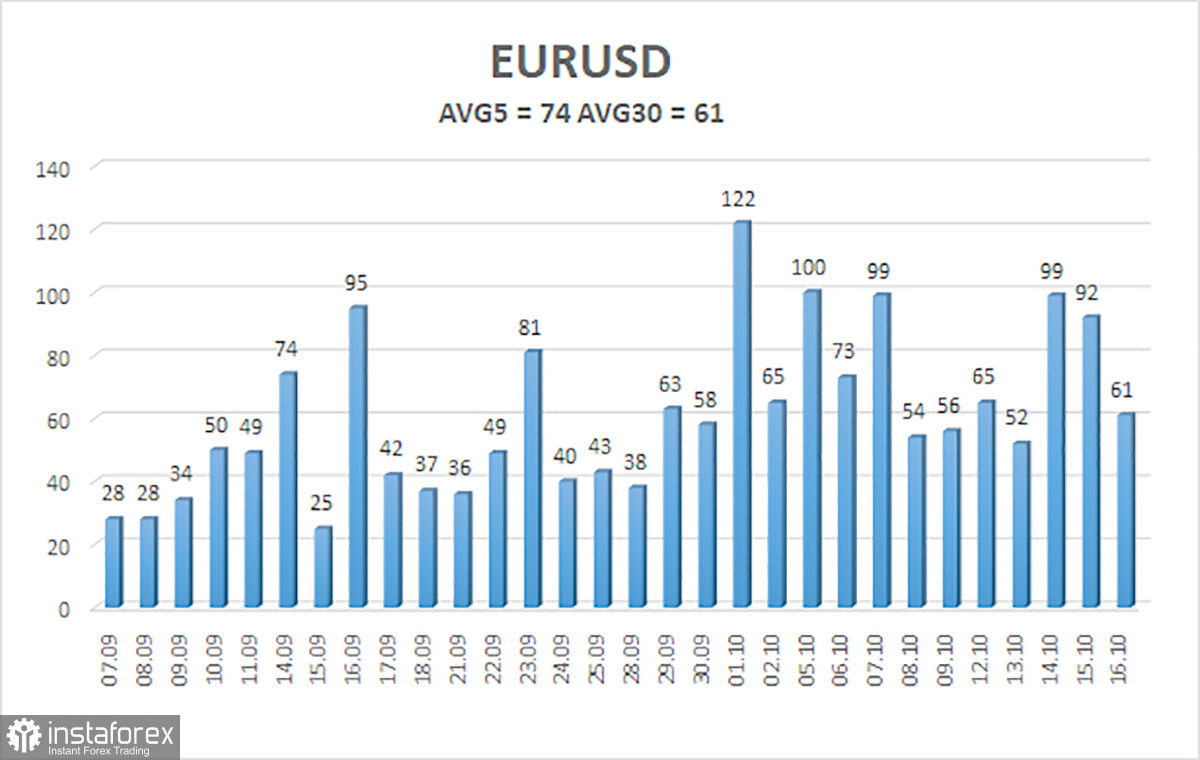
The average volatility of the EUR/USD currency pair over the last 5 trading days as of October 19 is 74 pips and is characterized as "average." We expect the pair to move between the levels 1.1166 and 1.1314 on Monday. The upper linear-regression channel has turned down, indicating another trend change. The CCI indicator entered the oversold area for the fifth time and formed four "bullish" divergences, warning that the illogical downtrend may be ending. However, the market is still only weakly responsive to technical signals.
S1 – 1.1230
S2 – 1.1169
S3 – 1.1108
R1 – 1.1292
R2 – 1.1353
R3 – 1.1414
The EUR/USD pair continues to move downward, but we still view the decline as a correction ahead of a new uptrend. The global fundamental backdrop for the dollar remains negative, but in 2026, geopolitics and then the Fed's hawkish stance provided strong support for the US currency. With price positioned below the moving average, short positions can be considered with targets at 1.1169 and 1.1108. Above the moving average, long positions are relevant, with targets at 1.1314 and 1.1353.


