
Vea también


 13.10.2026 04:29 AM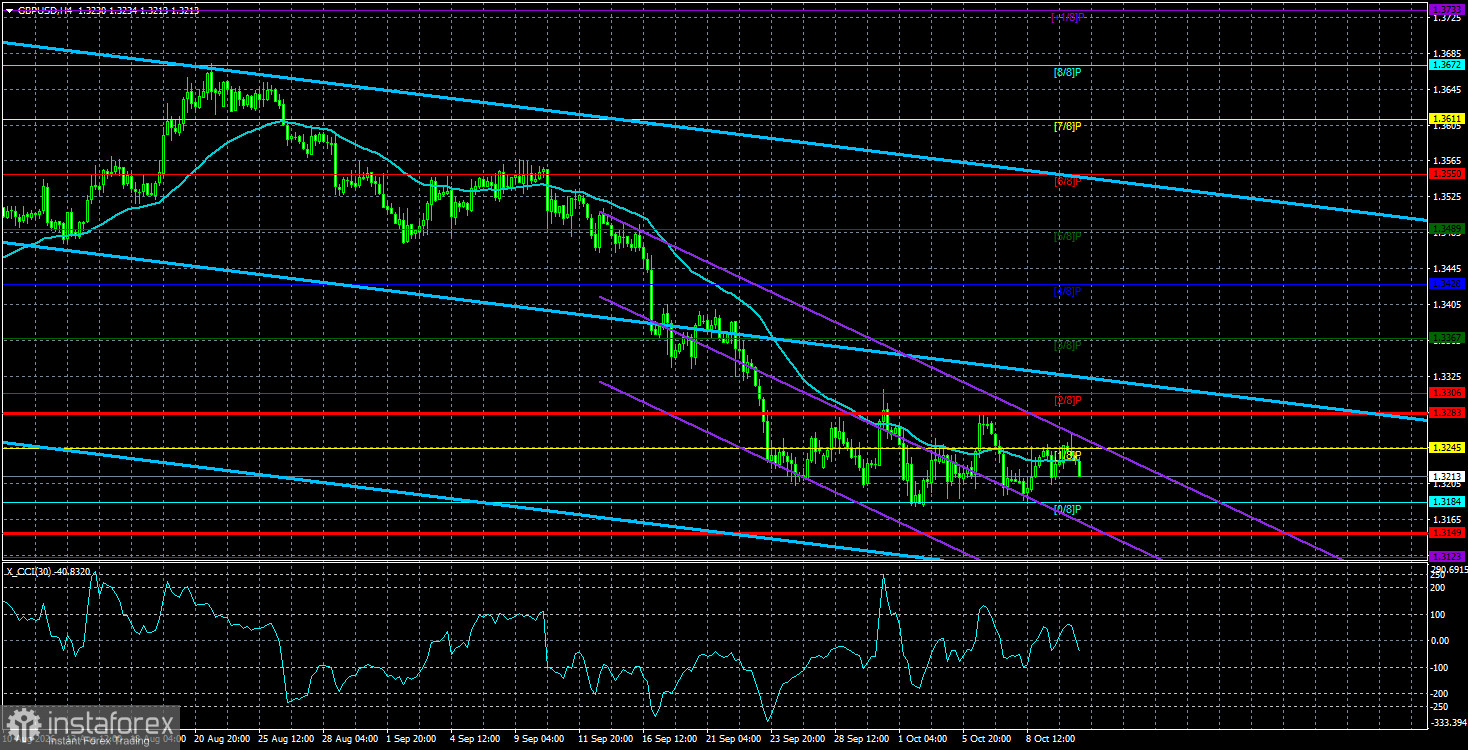
The GBP/USD currency pair traded quietly on the first day of the week, as expected. While the euro fell sharply again, the British pound remained stable. The pound has been in a sideways channel for the third week on the hourly (and 4-hour) timeframes, and it is also flat on the daily and weekly charts. This likely explains the absence of a pound decline even as the euro weakened.
The pound and the euro are roughly on equal footing, aside from the central banks' monetary policies. The European Central Bank has already tightened policy twice, while the Bank of England is only preparing to begin rate hikes. Logically, that should make the pound look weaker than the euro. But market movements are currently hard to explain with logic or analysis. Any analyst can point out that the UK has greater energy independence than the EU, so the pound should look stronger than the euro. Yet the UK still has its own problems: a budget gap, rising government bond yields, and ten years outside the EU have led the new government to openly discuss a potential return to the alliance.
What to discuss at the start of the new week if not upcoming events. Of all the events over the next four days, experts unanimously single out US inflation reports. In our view, those reports aren't especially significant because the dollar rises anyway, even after the Federal Reserve's hawkish tone softened. Therefore, the reasons for US dollar strength have long ceased to lie solely in Fed monetary policy. The Fed may raise rates only once more before year-end, as signaled by the dot plot on September 18. So after a month, it is hard to argue that expectations of tighter Fed policy still support the dollar if those expectations have, in fact, softened rather than hardened.
Therefore, in our view, the US inflation report may slightly strengthen hawkish market expectations or slightly soften them, but it will not change the dollar's trajectory. Members of the Fed's Monetary Committee understand that a single rate hike is insufficient to bring inflation back to the 2% target. Accordingly, rates will need to continue rising. US inflation will rise in September regardless, so how much higher makes little difference — further tightening will be required. The FOMC does not want to rush, so the hike will come later, for example in December.
The pound's salvation now lies solely in three sideways channels, with price trading near their lower boundaries.
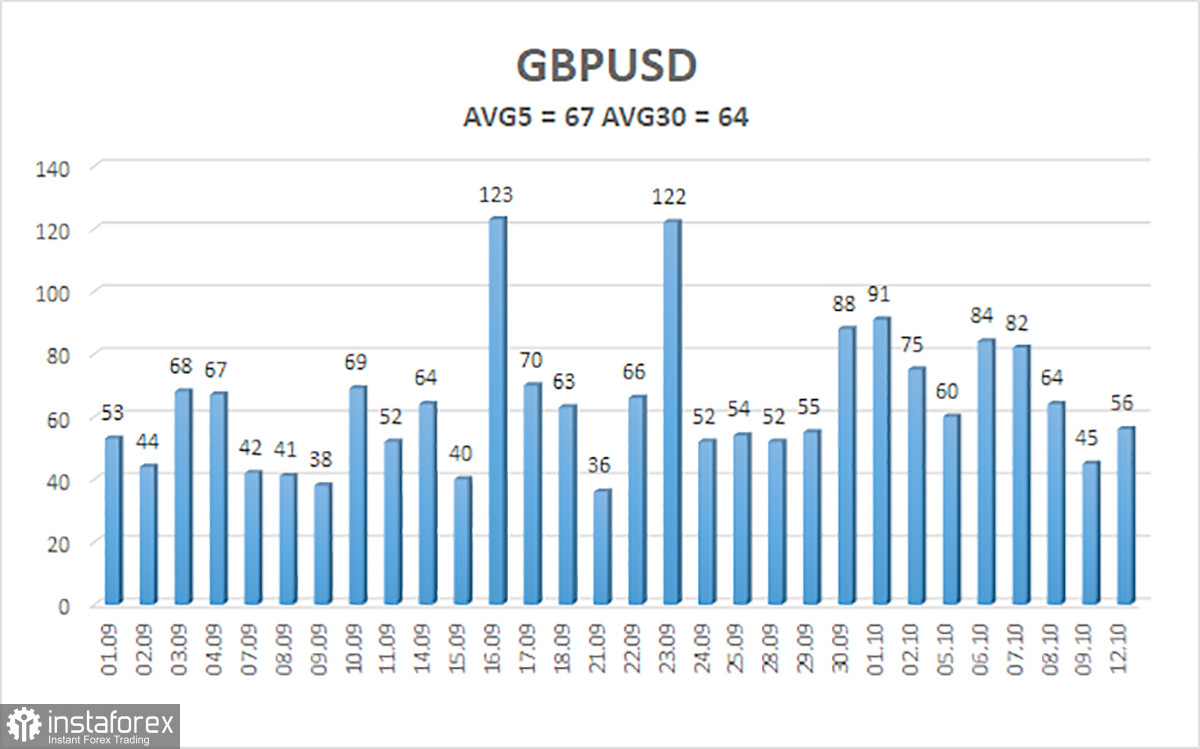
The average volatility of the GBP/USD pair over the last 5 trading days is 67 pips. For the pound/dollar pair, this value is considered "average". On Tuesday, October 13, we therefore expect movement inside a range bounded by 1.3149 and 1.3283. The upper linear regression channel is turning down again. The CCI indicator entered the oversold area twice, which warns of a possible end to the downward trend.
S1 – 1.3184
S2 – 1.3123
S3 – 1.3062
R1 – 1.3245
R2 – 1.3306
R3 – 1.3367
The GBP/USD currency pair continues its illogical downward move. Donald Trump's policies will continue to exert pressure on the US economy, so we do not expect long-term appreciation of the US dollar. The year 2026 so far has been favorable for the dollar due to geopolitics and inflation, which forced capital to seek safety and prompted the Fed to return to monetary tightening. However, on the weekly timeframe, a flat range between 1.3150 and 1.3780 persists within a four-year uptrend, supporting expectations for medium-term pound appreciation. Consider long positions with targets of 1.3367 and 1.3428 if price is above the moving average. If price is below the moving average, bearish trading is warranted, with targets of 1.3184 and 1.3149. Be cautious with short positions, as price is at the lower boundary of the long-term sideways channel!


