
Veja também


 19.10.2026 12:49 PM
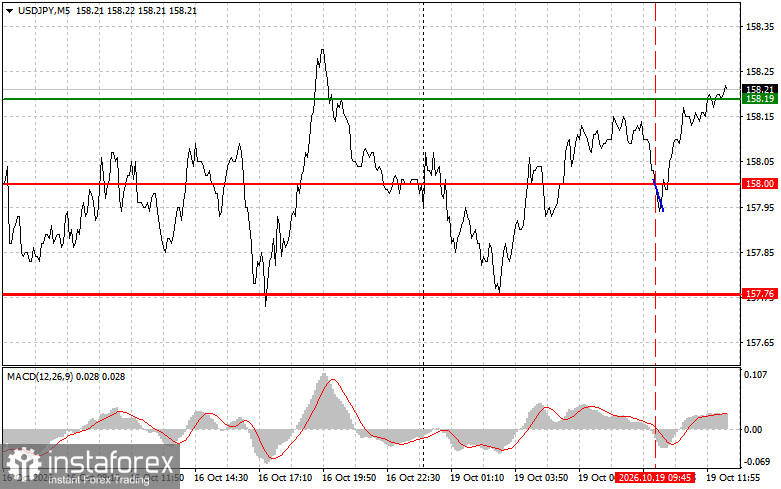
The test of the 158.00 price level occurred just as the MACD indicator was beginning to move down from the zero line, confirming that it was an appropriate entry point for selling the US dollar. However, the pair never declined, resulting in the loss being realized.
Given that the only US data release scheduled for the second half of the day is the NAHB Housing Market Index for October, the balance of forces is unlikely to change significantly. The yen is traditionally considered a safe-haven asset, but this status does not always hold during the current conflict. When markets fear an escalation and geopolitical risks increase, demand for the US dollar often proves stronger, particularly amid high US Treasury yields. It is no coincidence that in early October, the yield on 10-year US Treasury securities reached approximately 5.35%, its highest level since 2002. The yield differential and safe-haven demand for the dollar are jointly pushing USD/JPY higher. If tensions surrounding Iran and the Strait of Hormuz persist, the yen is likely to weaken against the dollar. An easing of tensions and a pullback in oil prices could help the yen recover some of its losses, but for now, the geopolitical backdrop is more favorable to the US currency.
As noted above, the only US data release scheduled for today is the NAHB Housing Market Index for October. It reflects homebuilders' confidence in the new housing market and is sensitive to mortgage rates, which are influenced by bond yields. This report rarely triggers significant moves in USD/JPY, so oil prices and the geopolitical backdrop will remain the main factors influencing the yen.
Regarding the intraday strategy, greater emphasis will be placed on implementing Scenarios No. 1 and No. 2.
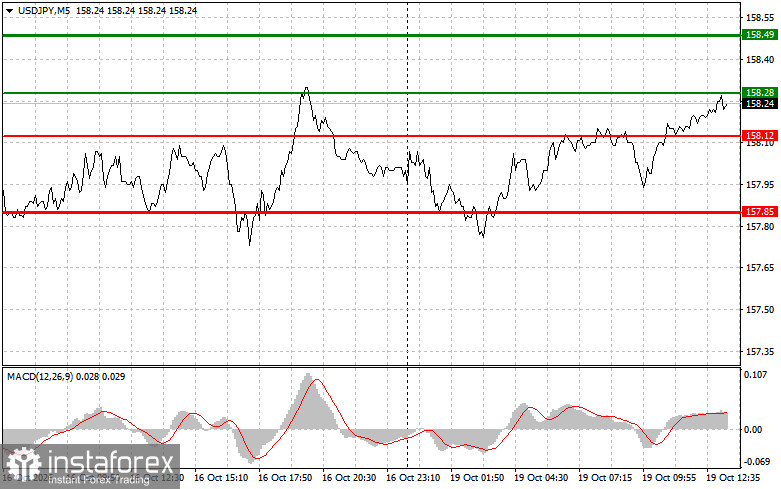
Scenario No. 1: The plan is to buy USD/JPY today when the entry point near 158.28 is reached (the green line on the chart), targeting a rise to 158.49 (the thicker green line on the chart). Near 158.49, the long position will be closed and a short position opened in the opposite direction, targeting a move of 30–35 points downward from that level. The pair could rise today, although the upward potential appears rather limited. Important! Before buying, make sure that the MACD indicator is above the zero line and is just beginning to rise from it.
Scenario No. 2: USD/JPY can also be bought today if the price tests the 158.12 level twice consecutively while the MACD indicator is in the oversold zone. This would limit the pair's downward potential and trigger a reversal to the upside. The pair could then rise toward the opposite levels of 158.28 and 158.49.
Scenario No. 1: The plan is to sell USD/JPY today after the price breaks below 158.12 (the red line on the chart), which could trigger a rapid decline in the pair. The key target for sellers is 157.85, where the short position will be closed and a long position opened immediately in the opposite direction, targeting a 20–25-point move upward from that level. Selling pressure on the pair could return today if the central bank intervenes. Important! Before selling, make sure that the MACD indicator is below the zero line and is just beginning to decline from it.
Scenario No. 2: USD/JPY can also be sold today if the price tests the 158.28 level twice consecutively while the MACD indicator is in the overbought zone. This would limit the pair's upward potential and trigger a reversal to the downside. The pair could then decline toward the opposite levels of 158.12 and 157.85.
Important. Beginner Forex traders should exercise considerable caution when making entry decisions. Before the release of major fundamental reports, it is best to stay out of the market to avoid exposure to sharp exchange-rate fluctuations. If trading during news releases, always place stop-loss orders to minimize losses. Without stop-loss orders, the entire trading account can be depleted very quickly, especially when large position sizes are used without proper money management.
Remember that successful trading requires a clear trading plan, such as the one outlined above. Making spontaneous trading decisions based on current market conditions is a fundamentally losing strategy for an intraday trader.


