
Veja também


 15.10.2026 04:40 AM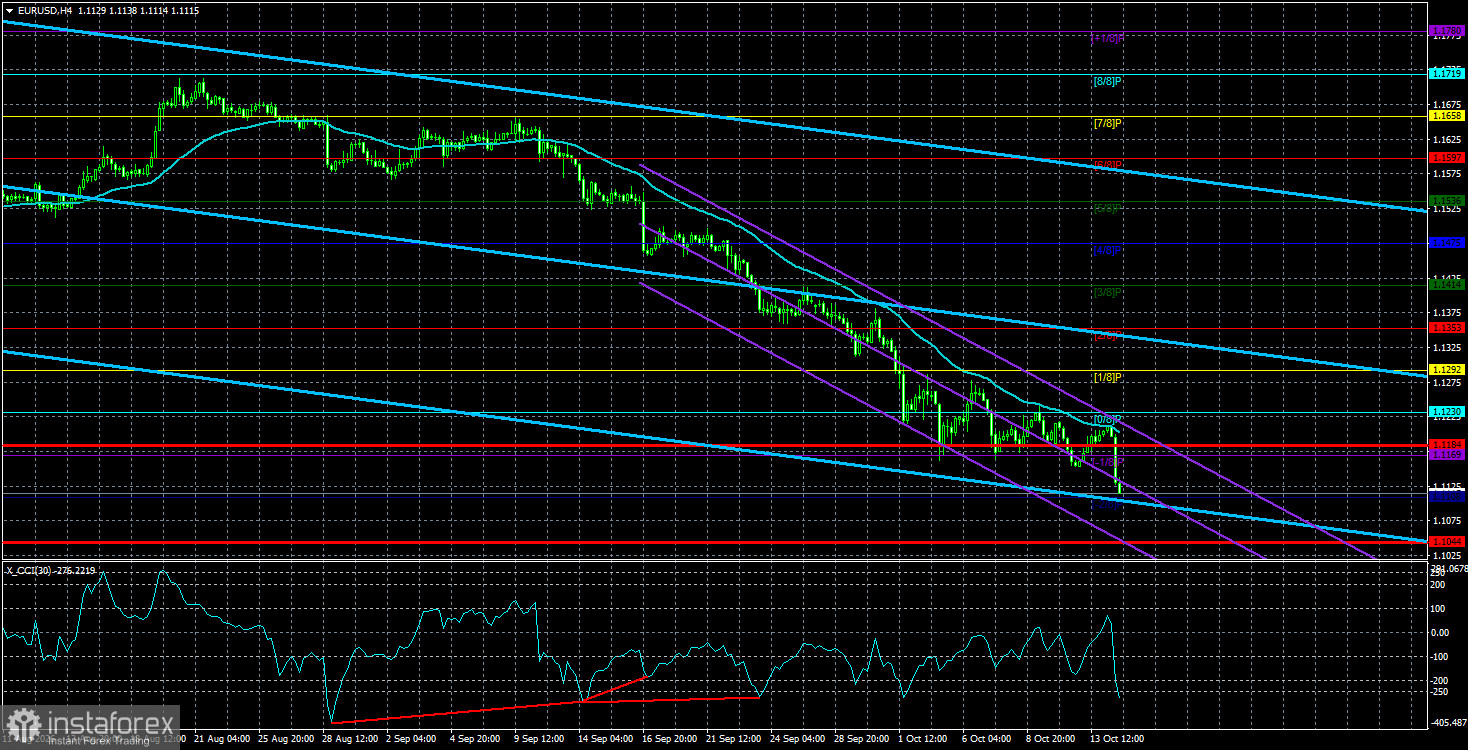
The EUR/USD currency pair eased slightly on Wednesday, then resumed its decline. Market moves have been fairly weak over the past week, but on Wednesday the price happily collapsed following the US inflation report. In any case, the EUR/USD rate continues to fall...
We are surprised when media outlets or web portals write things like "the dollar fell" or "the dollar came under pressure ahead of inflation." Under what pressure, and where did it fall to? The US currency has been rising for more than a month — if not every day, then almost every day. 30–40-pip pullbacks aren't even worth calling corrections. The US dollar is rising as if the Federal Reserve has already raised the policy rate about five times and plans to raise it roughly as many more times. But the reality is that the Fed may raise the policy rate only once more. And who can say after a month of dollar gains that the main cause was a tightening of Fed monetary expectations?
The September Fed meeting showed that most of the FOMC expects one more tightening—not repeatedly in 2026, but just one more. Recent comments by John Williams confirm the central bank plans one more hike in 2026, and expects inflation to slow and gradual easing to begin in 2027. So cumulatively the Fed may raise rates twice. Is that really enough to drive the dollar higher for a whole month? And we still cannot say the pair's decline is finished.
At the same time, the European Central Bank has already raised key rates twice and may deliver a third tightening before year-end. The Bank of England is only likely to begin tightening in early November, but that also implies at least two to three rate increases. In short, even counting the tightenings yet to occur, the Fed will tighten less than the ECB and the BoE. Yet the market keeps ignoring that, and analysts keep inventing fantastic reasons to explain the dollar's rise.
We continue to believe the story is one of inertia and speculation. No one will deny speculation exists in the FX market. Put simply, these are trades and actions by large players aiming to profit from exchange-rate moves. In essence, every trader is a speculator to some extent. But when the movement is speculative, many market participants refuse even to hear that explanation. Price has been moving in only one direction for a month. What is that if not an uninterrupted stream of dollar purchases? A stream that lacks sufficiently weighty reasons or foundations. Therefore, fundamentals and macroeconomic background currently mean nothing to traders. Price is moving on supply and demand that don't correlate with events, news, releases, or incidents.
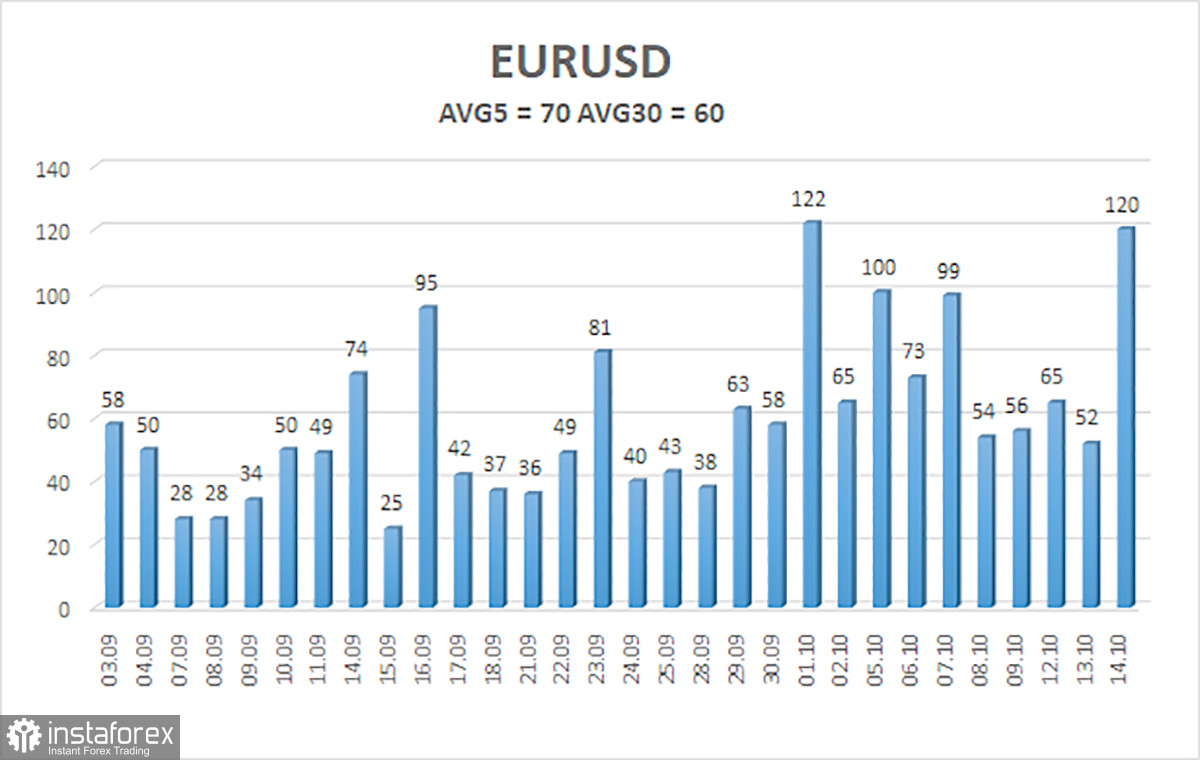
The average volatility of the EUR/USD currency pair over the last 5 trading days as of October 15 is 70 pips and is characterized as "average." We expect the pair to move between the levels 1.1044 and 1.1184 on Thursday. The higher linear-regression channel has turned down, indicating another trend change. The CCI indicator entered the oversold area for the fourth time and formed three "bullish" divergences, warning that the illogical downtrend may be ending. However, the market is not reacting to technical signals.
S1 – 1.1108
R1 – 1.1169
R2 – 1.1230
R3 – 1.1292
The EUR/USD pair continues to move downward, but we still view the decline as a correction before a new uptrend. The global fundamental backdrop for the dollar remains negative, but in 2026, geopolitics, followed by the Fed's hawkish stance, provided strong support for the US currency. With price below the moving average, short positions are possible, targeting 1.1108 and 1.1044. Above the moving average, long positions are relevant, with targets at 1.1292 and 1.1353.


