
Veja também


 13.10.2026 10:05 AM
Wall Street has seen this before — radio stocks in the 1920s, the Nifty Fifty in the 1970s, dot-coms at the turn of the century. A handful of favorite names pulls away each time, and the reckoning often comes faster than expected.
The S&P 500 Equal Weight Index has lagged the cap-weighted index for years, but the gap blew out after ChatGPT's November 2022 launch when AI became Wall Street's singular theme. Since then, the cap-weighted index has outperformed its equal-weight counterpart by nearly 50 percentage points. A gap of comparable scale appeared after Yahoo's 1996 IPO over a similar number of trading days.
Dynamics of normal S&P 500 vs. S&P 500 Equal Weight Index
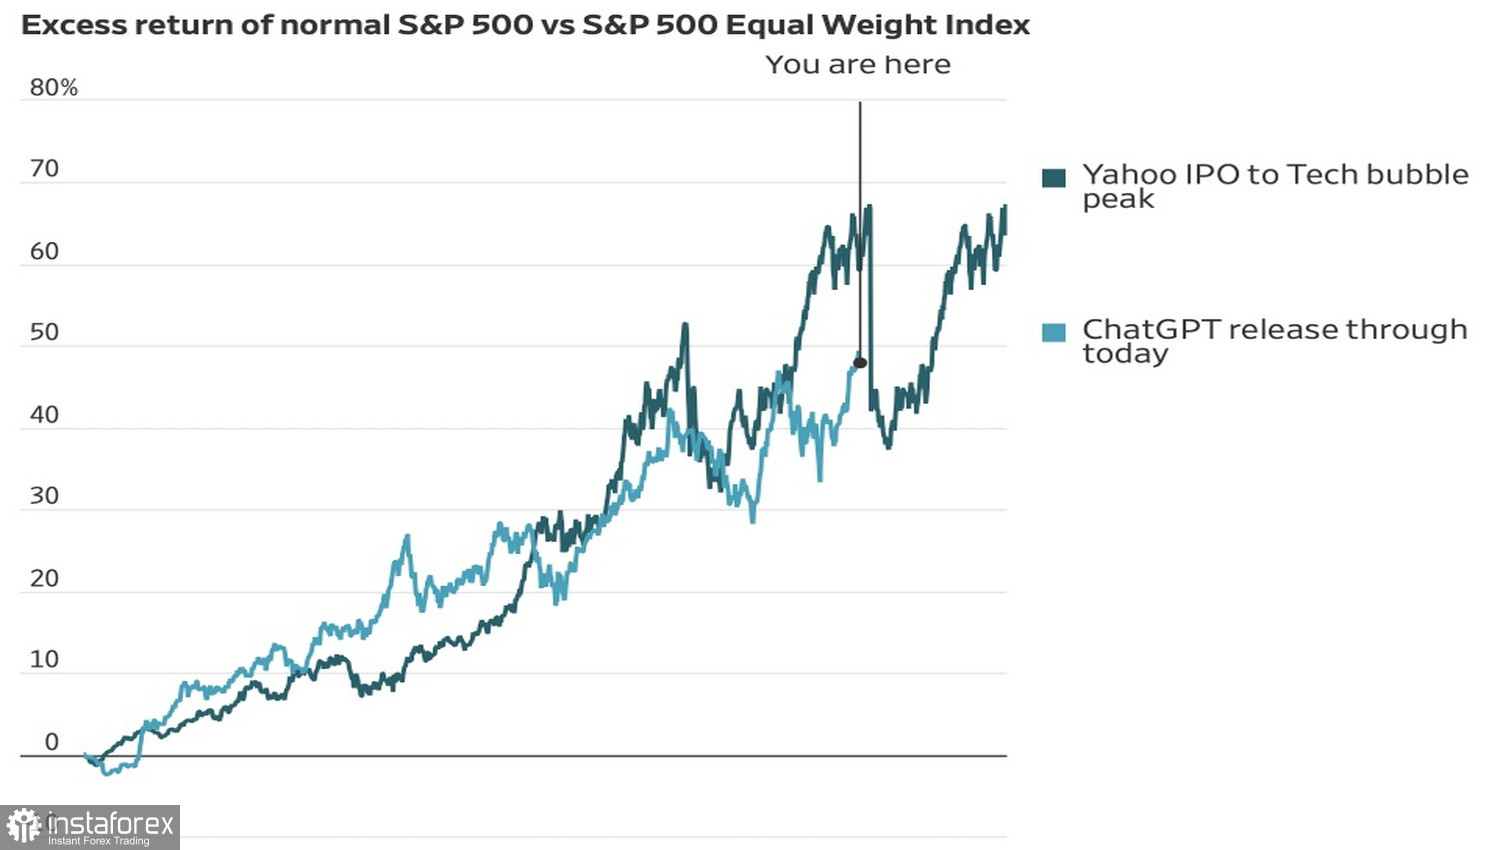
Does that mean the equal-weight index is simply inferior? Not at all — it actually outperformed the cap-weighted index from 1990 onward because equal weight favors smaller, cheaper stocks. The interesting part is behavior: when the equal-weight index catches up, it does so sharply and painfully — like a stretched rubber band finally snapping back.
The nature of this gap is a negative for market durability. When one group of companies accelerates away so sharply over a few years, it typically precedes a quick repricing and a bear market. The big technology breakthroughs of past eras did not change that pattern.
Goldman Sachs has raised its three-month outlook on equities to overweight from neutral, closer to its year-ahead bullish stance. The bank views earnings growth as a solid underpinning and judges stocks — even after the oil and yield moves — not as expensive as they once were.
Earnings season arriving soon lends a hand to the market. Bloomberg Intelligence notes that analysts expect S&P 500 companies to report roughly 25% annual earnings growth in Q3, one of the strongest rates historically. Goldman thinks the figure may come in even higher.
Dynamics of capital flows into US funds
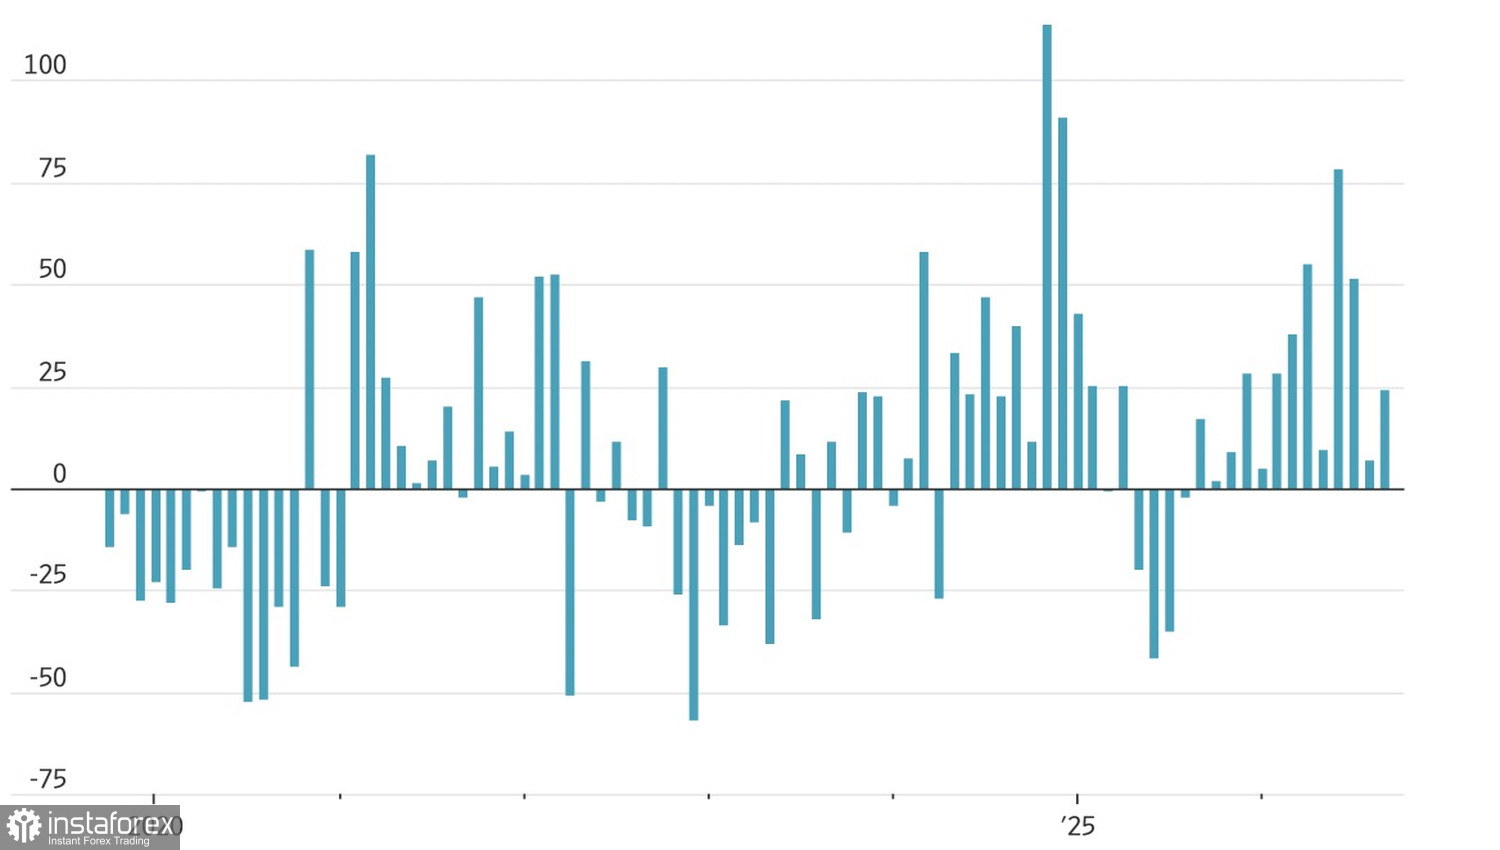
Fund-flow dynamics also support equities: US fund inflows have continued for 13 consecutive months, marking the longest streak in EPFR data since 2000.
The energy sector of the S&P 500 hit a one-month high as Brent topped $106/bbl after strikes on Ukraine's energy infrastructure, despite President Trump's announcement of a truce. He also said he negotiated diesel shipments with Russia to ease prices.
I wouldn't argue with Goldman Sachs on a quarter view, but on a historical horizon, I'd bet on the rubber band snapping.
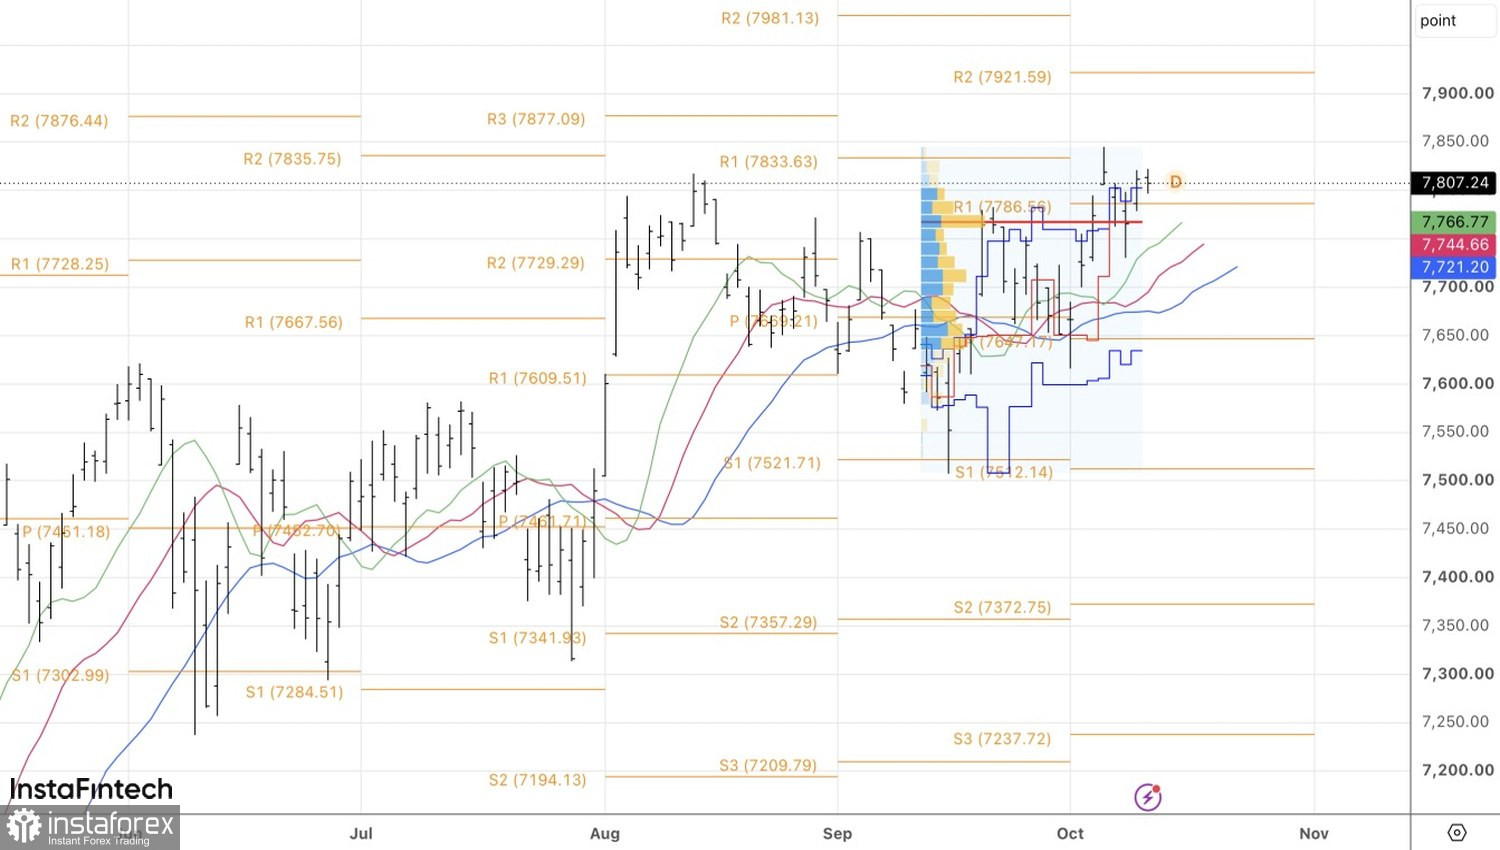
Technically, the daily chart for the S&P 500 can be read two ways: a recovery of the uptrend or an activation of a 1?2?3 reversal pattern. A drop below fair value at 7,770 would be a sell signal, while a sustained move above 7,825 would be grounds to add long positions.


