
Lihat juga


 19.10.2026 03:17 PM
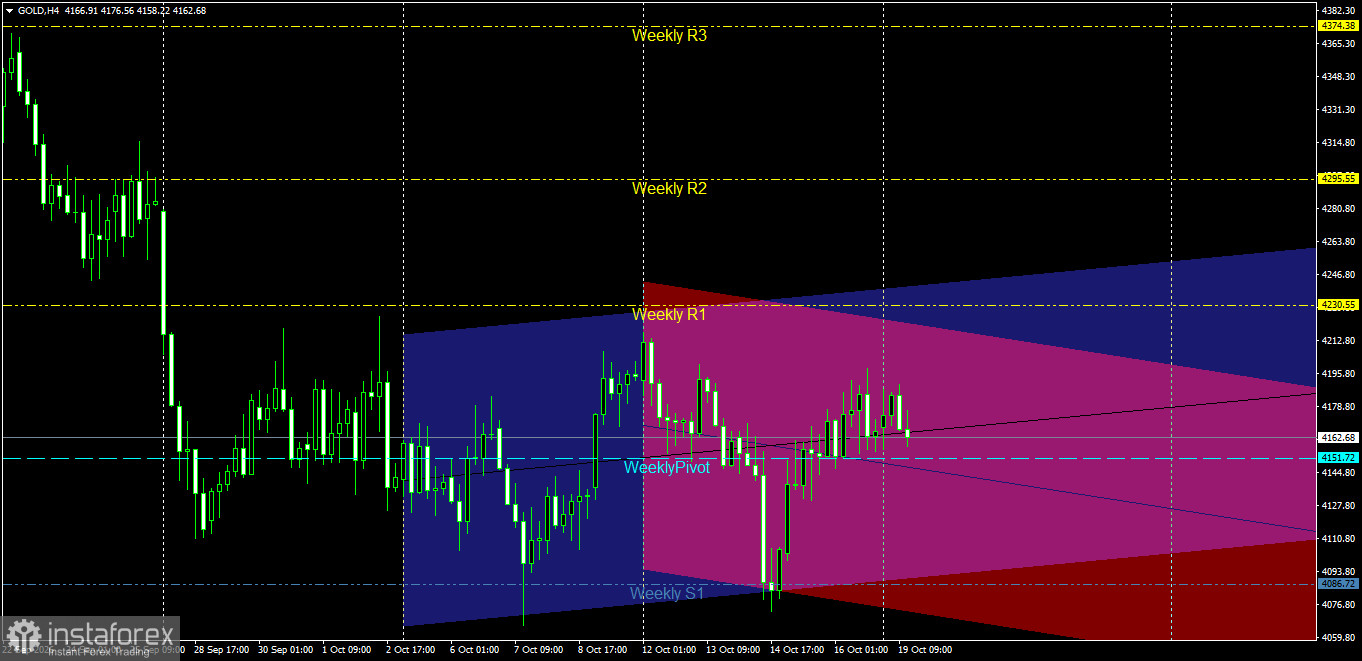
The technical analysis of the four-hour (H4) chart for Gold (GOLD) utilizes a set of precise technical tools to identify the overall trend and key pivot levels. Major support and resistance levels are determined using the weekly pivot indicator, which establishes the weekly pivot point at 4151.72, the first weekly resistance (R1) at 4230.55, the second (R2) at 4295.55, and the third (R3) at 4374.38, alongside the first weekly support (S1) at 4086.72. Furthermore, the analysis incorporates price channels covering two distinct timeframes: the blue channel represents the price range and trend over the preceding two weeks, while the red (pink) channel reflects the sub-trend and range of fluctuation over the past week alone.
Regarding price behavior since the start of this week's trading, Gold has opened with a sideways consolidation, showing a slight, short-term bullish bias around the 4162.68 level. The price has demonstrated notable resilience and stability above the weekly pivot point of 4151.72, attempting to build upon a previous positive rebound from a pivotal low near the first weekly support level of 4086.72. Current price action shows repeated attempts to establish a support base above the weekly pivot level, aiming for a push toward the upper boundary of the sub-channel and a test of nearby resistance zones.
Based on these technical factors, two key scenarios for the upcoming movement are anticipated:
Primary Scenario (Bullish): Assumes the price remains stable above the weekly pivot level of 4151.72. This would drive gold toward an initial target of 4195.80, with the potential for further gains toward the first weekly resistance level at 4230.55.
Alternative Scenario (Bearish): Triggered if the price breaks below the weekly pivot level of 4151.72 and closes beneath it with a strong 4-hour candle. This would open the door for a pullback toward the intraday support zone at 4127.80 and the first weekly support level at 4086.72.
Tips for Successful Trading: It is advisable to wait for confirmation signals before entering a position. Strictly adhere to risk management protocols by limiting the risk per trade to no more than 2% of your capital. For long positions, place a stop-loss order below the weekly pivot level to protect your account against sudden market volatility.
The daily chart shows the price undergoing a corrective downward wave following a rebound from the second monthly resistance level at 4659.09. The price is currently trading at 4161.40 within a minor, pink-colored descending channel, which is contained inside a broader, blue-colored primary channel.
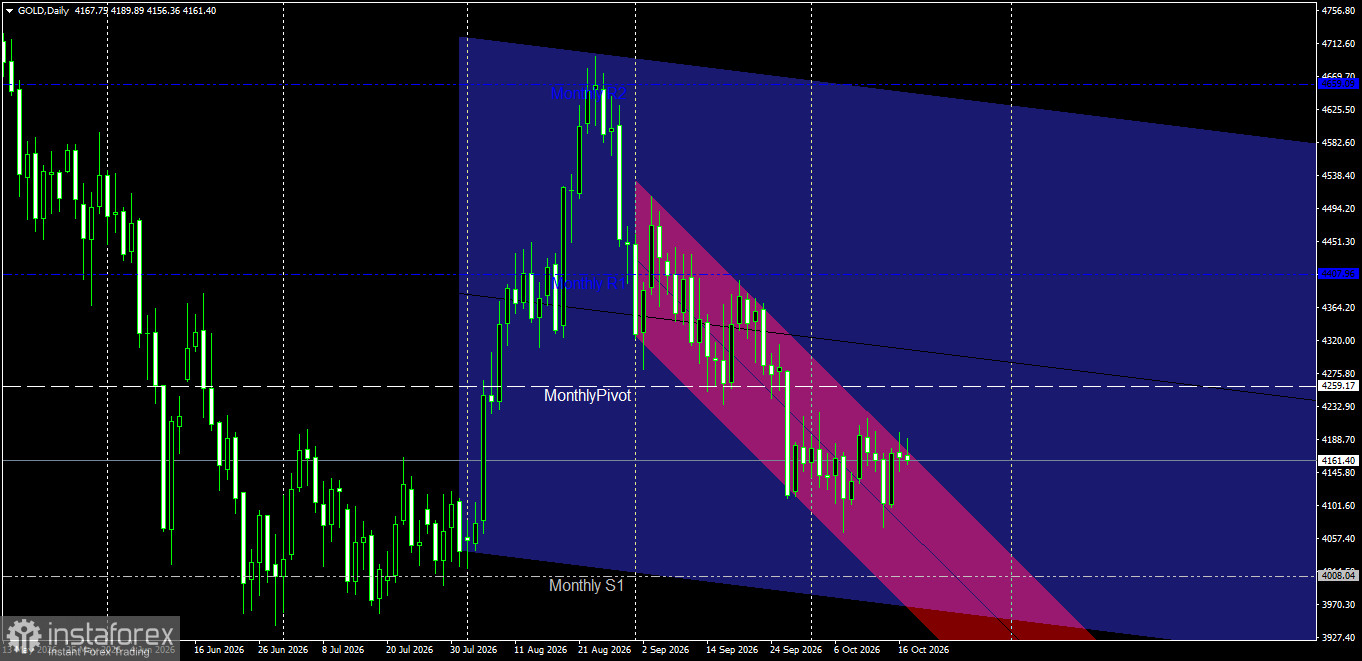
Continued trading below the monthly pivot point—set at 4259.17—confirms that selling pressure remains dominant in the medium term. The price is currently in a phase of sideways fluctuation and consolidation above local lows, near the first monthly support level at 4008.04.
Bullish Scenario: This remains contingent upon a breakout above the monthly pivot at 4259.17 and an exit from the descending channel, targeting 4407.96.
Bearish Scenario: If the current resistance holds, the potential for renewed negative pressure remains, which could lead to a test of the key support level at 4008.04.


